Testing a Software System using the Command Line Interface
Overview
This beginner-level tutorial demonstrates the simplest way of interacting with the Causal Testing Framework (CTF), which is via the command line interface (CLI). This example provides a high-level overview of how to carry out a Systems Analysis of the Covasim framework - the epidemiological COVID-19 Agent-based Simulator (Covasim) model that was used by the UK government to base their COVID-19 policy. Covasim is an example of a complex, non-deterministic epidemiological model with many unknown inputs, making conventional software testing approaches challenging.
The core idea of the CTF is to employ causal inference; a family of statistical techniques that provides a way to address the challenges described above. The CTF provides a way of leveraging the tester’s domain knowledge by formalising the system’s cause–effect relationships, enabling better predictions of how changes to inputs should affect outputs without requiring large numbers of controlled tests. In this tutorial, we’ll be using the CLI to test for the following systems analysis scenario produced by Covasim: prioritising the elderly for vaccination should not affect the maximum number of vaccinations each agent receives. The runtime Covasim data was generated with the following constraints: 50,000 agents runs, for 50 days and an infected population of 1000.
Step 1: Prepare your Inputs
To use the CLI, we only need the following 3 inputs:
A causal directed acyclic graph (DAG) specifying any causal relationships between variables (a
dotfile).Runtime data from your system (a
csvfile) where columns represent variables and each row represents a run of the model.Causal test cases containing the interventions whose effect we’d like to test (a
jsonfile).
Note: If you haven’t created your own causal tests, it’s possible to utilise the CTF to automatically generate tests based on your input DAG using the following command:
causal-testing generate --dag_path dag.dot --output_path causal_tests.json
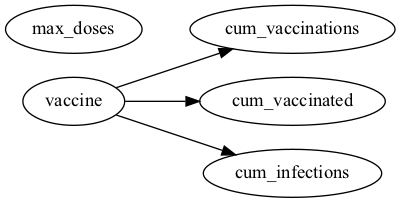
Figure 1: The Causal DAG we’ve created demonstrating the relationships between the variables.
The causal DAG in Figure 1 highlights the causal relationships we would like to test. The variables here are as follows:
vaccine- The type of vaccine given (Phizer,Astrazenika, etc.).max_doses- The maximum number of doses given per agent in the model. In this example, agents should not be given more than two doses each.cum_vaccinations- Cumulative vaccinations given in the population.cum_vaccinated- Cumulative number of agents in the population who have received at least one vaccination.cum_infections- Cumulative number of infections in the population.
Note, we’re specifying here that the vaccine should cause changes to all variables, except max_doses. This is because changing the target population should not affect the maximum doses received when at most two doses are given to each agent.
In this example, we’ve already provided a simulated runtime dataset in csv format, with a column for each variable mentioned above (it may help to inspect simulated_data.csv for your own understanding).
vaccine_type |
max_doses |
cum_vaccinations |
cum_vaccinated |
cum_infections |
|---|---|---|---|---|
pfizer |
2 |
149992 |
50000 |
4034 |
pfizer |
2 |
149990 |
50000 |
4006 |
pfizer |
2 |
149990 |
50000 |
3968 |
We’ve also constructed our causal tests, which contain the tests for our example within the causal_tests.json file. An example of a causal test case is shown below, which is testing whether max_doses is statistically independent from cum_vaccinations. Each causal test case consists of key-value pairs representing its attributes. Simply put, in the example below, we’ve created a test case to test whether the treatment variable (max_doses) is statistically independent of the
outcome variable (cum_vaccinations). A linear regresison estimator is employed to model the relationship, with alpha representing the \(5\%\) significance level (\(95\%\) confidenve level). More information on the test case attributes is available via our API reference.
{
  "tests": [
    {
      "name": "max_doses _||_ cum_vaccinations",
      "estimator": "LinearRegressionEstimator",
      "estimate_type": "coefficient",
      "effect": "direct",
      "treatment_variable": "max_doses",
      "expected_effect": {
        "cum_vaccinations": "NoEffect"
      },
      "estimator_kwargs": {
        "formula": "cum_vaccinations ~ max_doses",
      },
      "alpha": 0.05,
      "skip": false
    },
  ]
}
Step 2: Execute the Tests
Once you’ve gathered your runtime data, causal tests, and DAG file, you can run the following command to execute the tests and generate the causal test results:
[1]:
!causal-testing test --data-paths simulated_data.csv --dag-path dag.dot --test-config causal_tests.json --output causal_test_results.json
2026-04-29 14:55:38 - causal_testing.main - INFO - Setting up Causal Testing Framework...
2026-04-29 14:55:38 - causal_testing.main - INFO - Loading DAG from dag.dot
2026-04-29 14:55:38 - causal_testing.main - INFO - DAG loaded with 5 nodes and 3 edges
2026-04-29 14:55:38 - causal_testing.main - INFO - Loading data from 1 source(s)
2026-04-29 14:55:38 - causal_testing.main - INFO - Initial data shape: (60, 16)
2026-04-29 14:55:38 - causal_testing.main - INFO - Setup completed successfully
2026-04-29 14:55:38 - causal_testing.main - INFO - Loading test configurations from causal_tests.json
2026-04-29 14:55:39 - root - INFO - Running tests in regular mode
2026-04-29 14:55:39 - causal_testing.main - INFO - Running causal tests...
100%|████████████████████████████████████████████| 9/9 [00:00<00:00, 741.98it/s]
2026-04-29 14:55:39 - causal_testing.main - INFO - Saving results to causal_test_results.json
2026-04-29 14:55:39 - causal_testing.main - INFO - Results saved successfully
2026-04-29 14:55:39 - root - INFO - Causal testing completed successfully.
Step 3: Evaluate the Results
The output above shows logs generated by the CTF. Initially, it confirms the input configuration, including the DAG structure, runtime data shape, and loaded causal test cases. It also states that the results have been saved within ./causal_test_results.json. Below is the causal test result from the example causal test case described above:
{
    "name": "max_doses _||_ cum_vaccinations",
    "estimate_type": "coefficient",
    "effect": "direct",
    "treatment_variable": "max_doses",
    "expected_effect": {
      "cum_vaccinations": "NoEffect"
    },
    "estimator_kwargs": {
      "formula": "cum_vaccinations ~ max_doses",
    },
    "alpha": 0.05,
    "skip": false,
    "passed": false,
    "result": {
      "treatment": "max_doses",
      "outcome": "cum_vaccinations",
      "adjustment_set": [],
      "effect_measure": "coefficient",
      "effect_estimate": {
        "max_doses": 156420.11333333337
      },
      "ci_low": {
        "max_doses": 131300.5799204585
      },
      "ci_high": {
        "max_doses": 181539.64674620825
      }
    }
  }
The interpretation of this finding is that the test case expected max_doses to have no effect on cum_vaccinations; however the CI does not include 0 and the test fails as there is an effect, and the independence assumption fails. Similar insights can be made by evaluating the other test results within the causal_test_results.json file. The json format of the causal test results provide a simple way for users to simply parse the outputs and carry out additional data visualisation
and analysis. For a more detailed tutorial, we recommend reviewing the Poisson Line Process tutorial.
Additional Resources
[ ]: